Why an Effective Asheville Real Estate Agent Matters More Than Ever
According to the National Association of REALTORS® Profile of Home Buyers and Sellers, today’s consumers consistently rank one factor above all others when choosing a real estate professional: effectiveness. In an increasingly complex market, buyers and sellers are looking for agents who can deliver results, guide them confidently through the process, and advocate for their best interests from start to finish.
For buyers, effectiveness means far more than opening doors. It’s about identifying the right home based on lifestyle, budget, and long-term goals. It’s about skillful negotiation—securing favorable terms and pricing in competitive situations—and managing the paperwork and timelines that can otherwise feel overwhelming. A strong buyer’s agent acts as both advisor and protector, helping clients make informed decisions every step of the way.
For sellers, an effective agent is one who understands how to position a home to stand out. This includes pricing the property strategically based on current market conditions, developing a targeted marketing plan, and attracting qualified buyers who are ready to act. Sellers also rely on their agent to manage showings, negotiate offers, and keep the transaction moving smoothly so their home sells within their desired timeframe.
While national reports provide valuable insight, real estate is ultimately local. There is no single housing market in the United States—there are thousands of distinct, hyperlocal markets, each shaped by its own trends, inventory levels, neighborhoods, and buyer demand. What works in one city, or even one ZIP code, may not work in another.
That’s where local expertise becomes invaluable. The most successful agents are those who have spent years building relationships, understanding micro-markets, and earning the trust of their communities. They know the nuances of neighborhoods, the rhythm of the local market, and how to adapt national trends to local realities.
In real estate, experience, local knowledge, and effectiveness are not optional—they are essential. Whether you are buying your first home, selling a long-held property, or making a strategic move, working with an agent who truly understands your market can make all the difference.
Give us a call to discuss your real estate plans for the new year. 828-258-2953


.jpg)
.jpg)
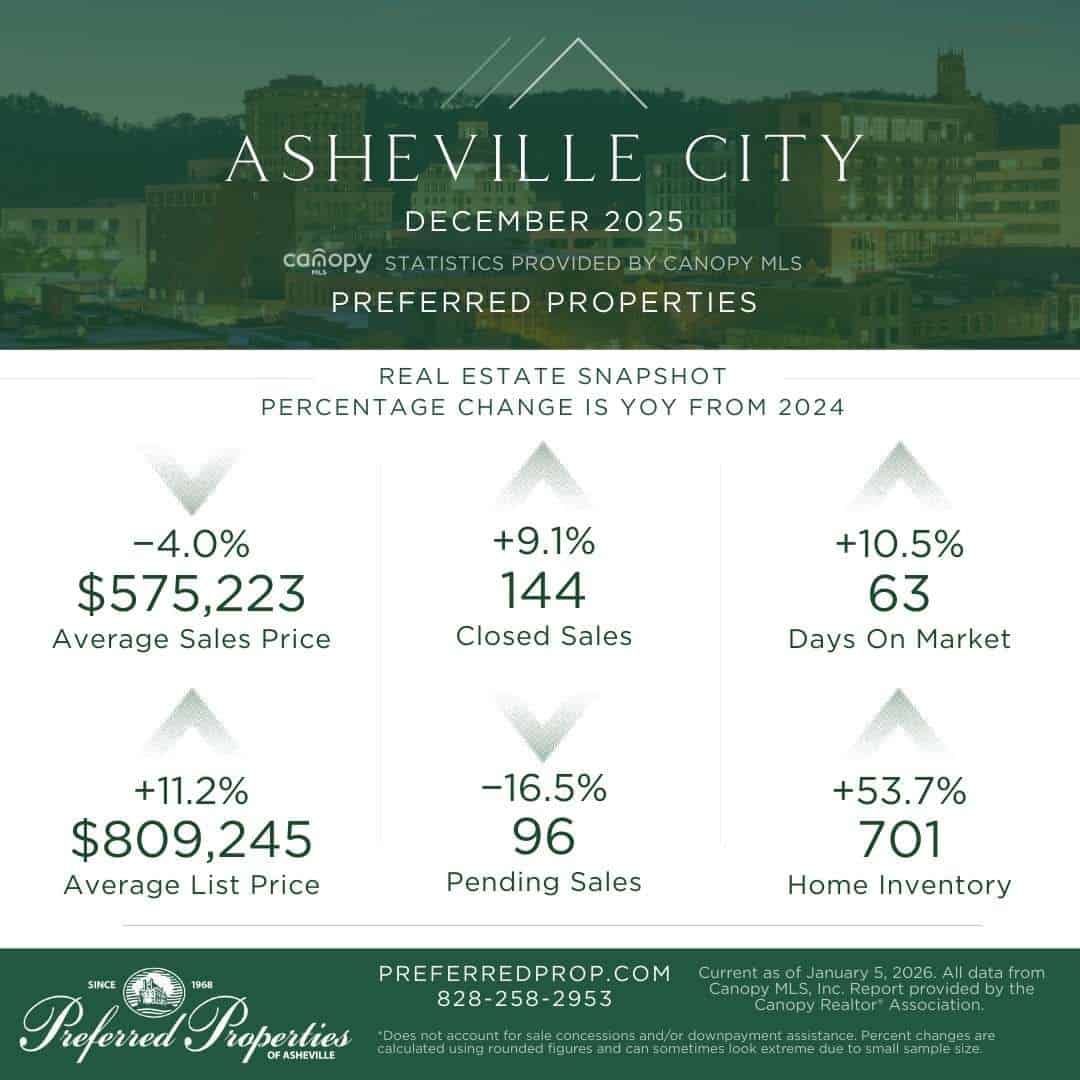
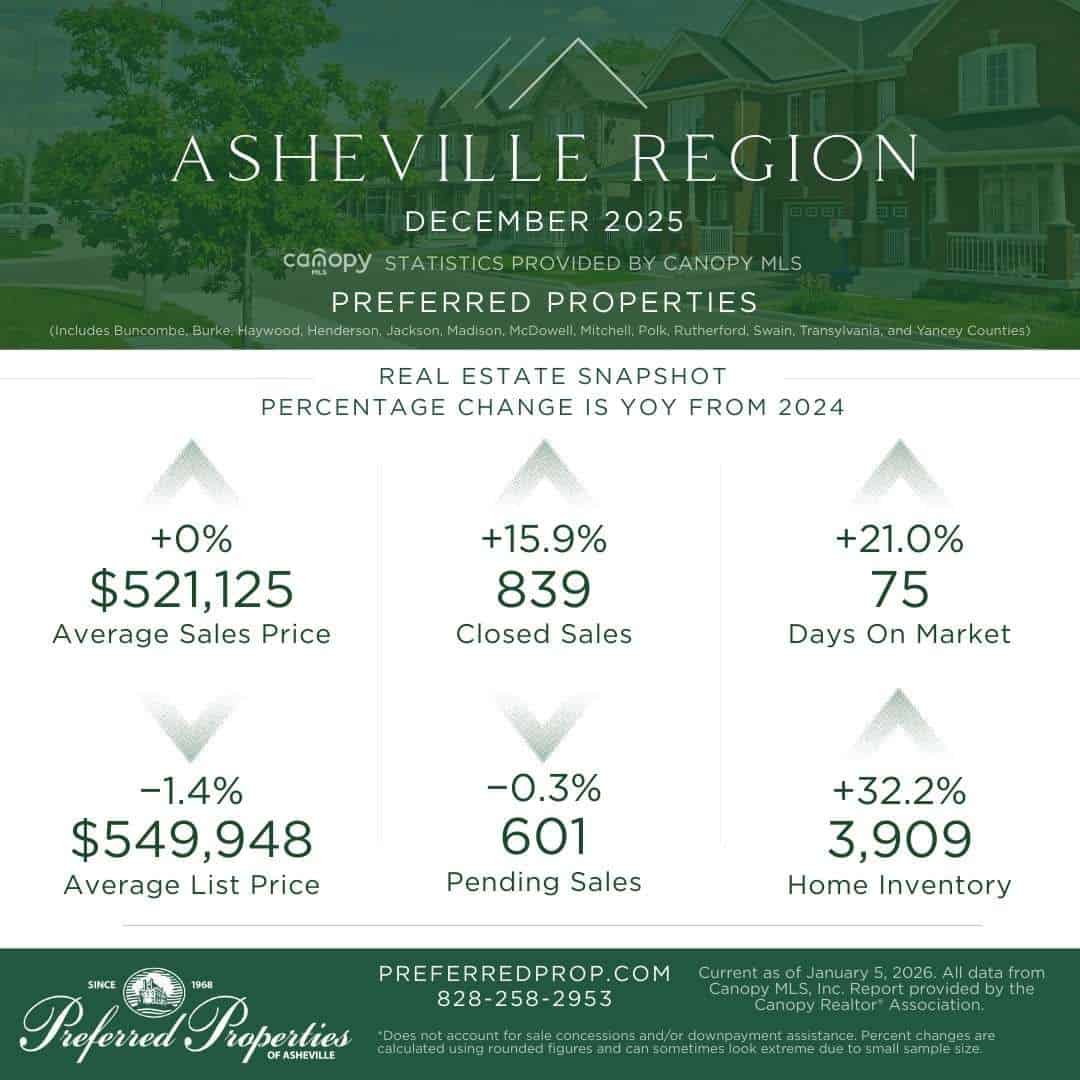


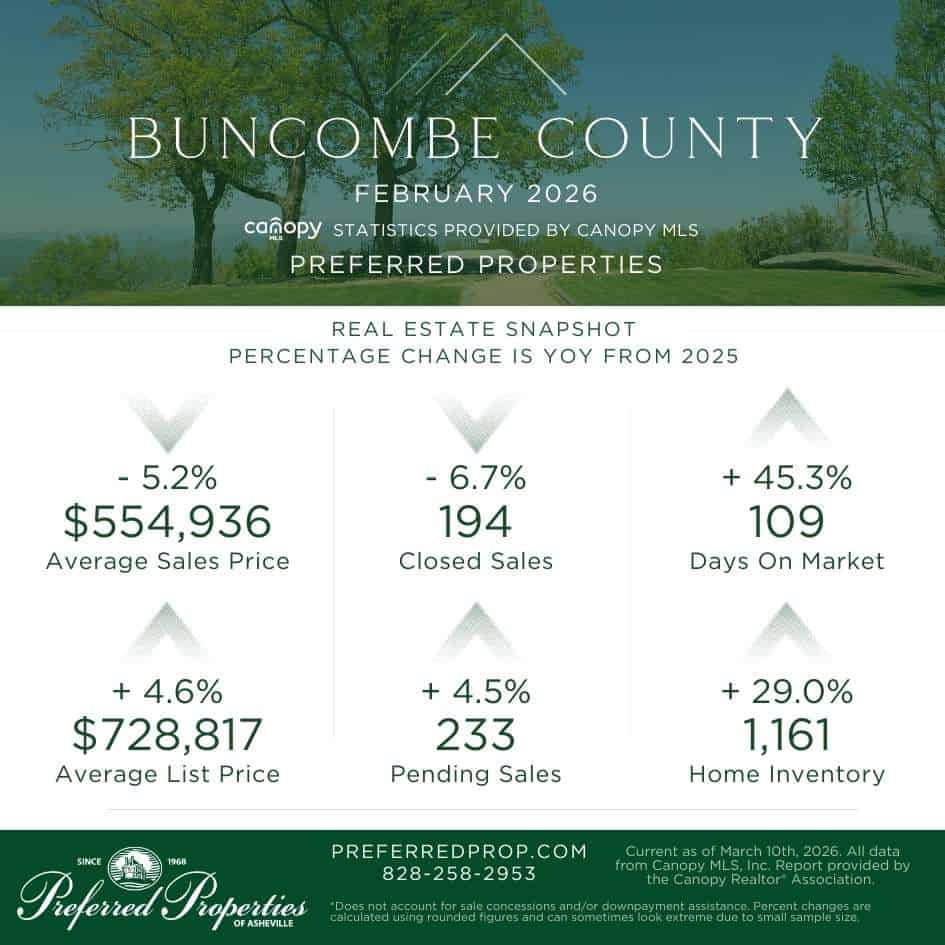
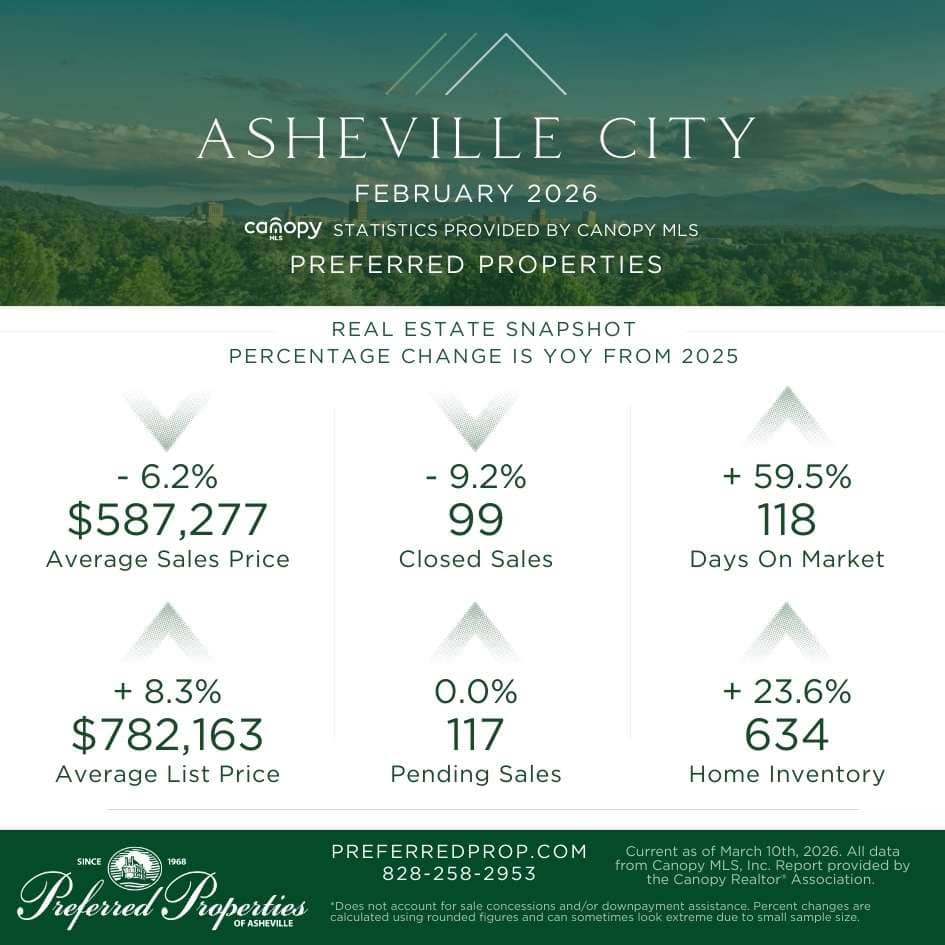
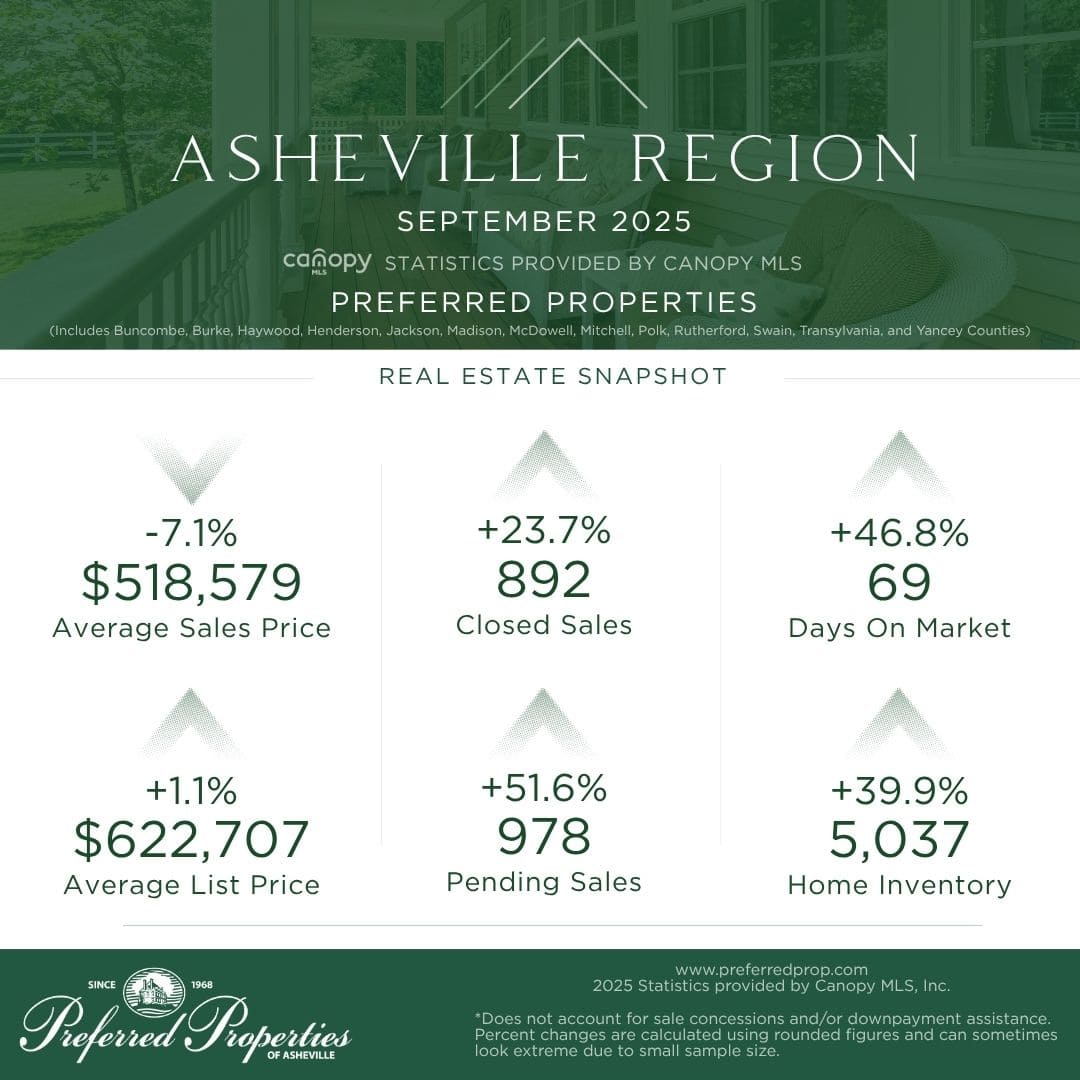
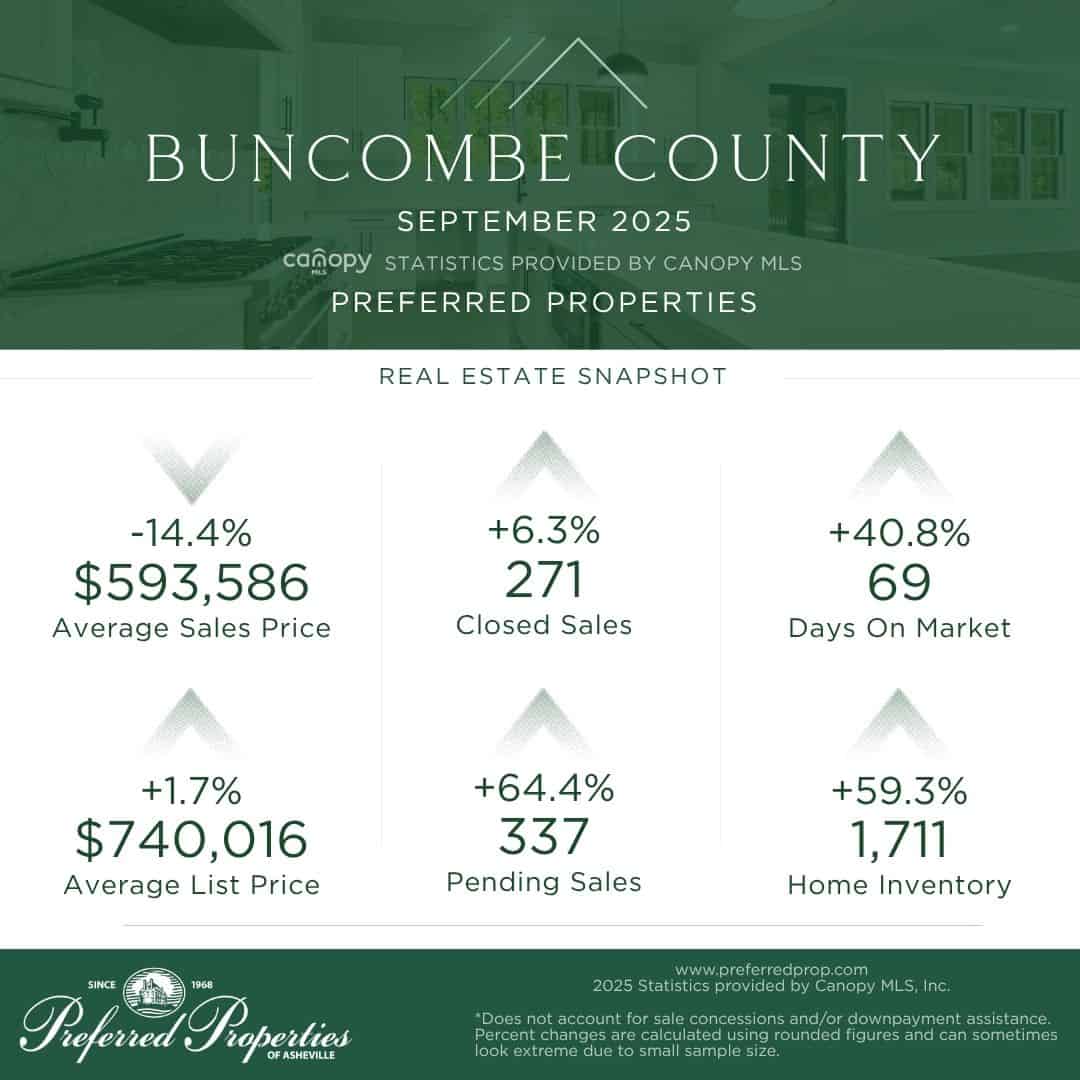
 Percentage change is year-over-year from 2024.
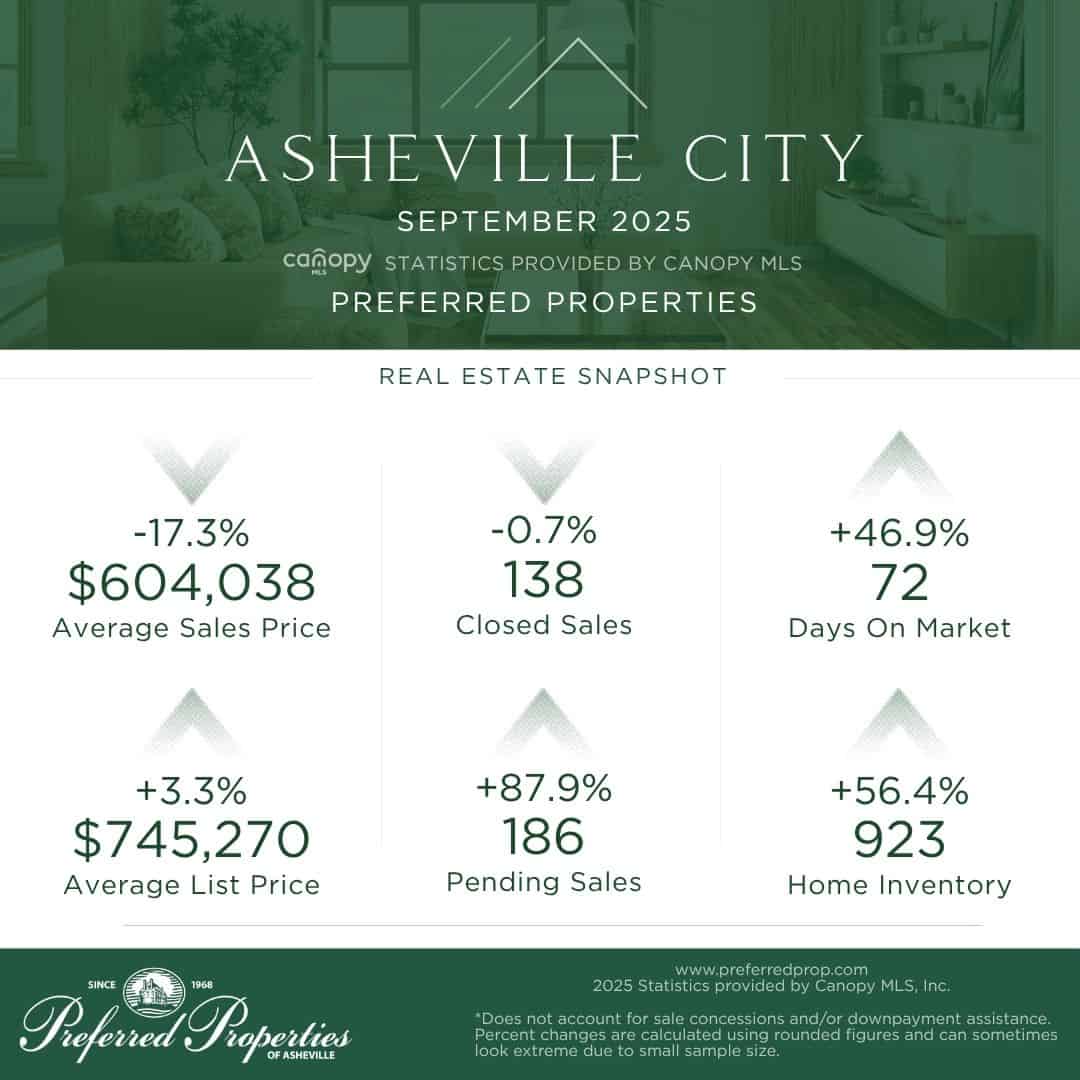
 City of Asheville


 Thinking about making a move?
 828-258-2953


Connect